As you're probably aware, with newly available vCenter Operations Management Suite 5.0 the vC Ops dashboard has been enhanced with a number of new badges and additional graphs and charts. Lot's a good info and still very intuitive and easy to use.
Good news is that the custom UI is also available in vC Ops 5.0, giving you the ability to create dashboards for app owners, executive management team and the like. You can even create a dashboard using Google Maps to show various physical locations with status indicators for various infrastructure resources like the one below.
You can access the custom UI by hitting
https://VCOPS-Admin-UI-VM/custom
and logging in with your vC Ops admin credentials. Feel free to look around, but to activate and use the GEO location feature to enable the maps on your dashboard, you will first need to get a Google Maps API key. To do this, you'll need a Google account so you can log into the Google APIs Console -
https://code.google.com/apis/consoleOnce you log in, provided you've never used Google APIs console before, you will be presented with the image below - click the "Create project...." button and give your project a name.
From the list of available APIs you will want to enable the Google Maps API v2 shown in the image below.
You will have to read and agree to the Google EULA. Please read and understand the Google EULA. I am simply guiding you in how to set up this feature and any questions about entitlements for use should be directed to Google. Note that you have a "courtesy limit" of 25,000 queries per day. This should be ample for a lab or demo environment, but if you're going to use this for your production monitoring it would be a good idea to get pricing for activity above that limit. From the Google APIs console, you can monitor the amount of queries against your API, if you're interested.
Once that has been done, you can now get your key from your project's API console by selecting the API Access link. You only need the Simple API Access key for vC Ops.
Back in the vC Ops custom UI, select the Admin pull down menu item and choose Global Settings. As shown below, you will enter your Google API key here - be sure to select Google as the map provider. My key was obscured for this image, you will want to protect your key so that someone else doesn't use it and eat up all your queries!
Now you will need to add values for the GEO location resource tag. This resource tag is created by default but is not populated with information. Basically, this is where you will add map locations that you want to link to various resources (e.g. datacenters).
1. From the Environment pull down menu item choose "Environment Overview."
2. From the "List" tab view, click on the wrench icon to bring up the "Manage Resource Tags" pop-up.
3. Select "GEO Location" tag name and click the icon indicated below to add a "Tag Value"
4. Enter the name of your location
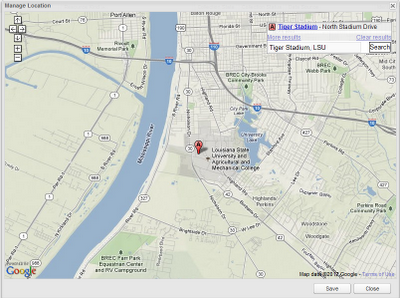
5. Click on the wrench icon to manage the location - this will pop up a Google map an allow you to search for and select a location. Notice I've selected LSU's world famous Tiger Stadium, where Alabama will suffer a humiliating loss on November 3rd, 2012. :)
BE SURE to click on the blue hyperlink of the location you wish to activate that as your GEO location before clicking the "Save" button.
At this point, you just need to add some resources to your data center location. While in the Environment Overview, simply drag any resources you want to associate onto the GEO Location tag you created. In my case, I added several types of objects as you can see below.
You can now check your GEO Location on a map by switching to the Geographical tab. As seen in the image below I have zoomed in for more detail on my location at Tiger Stadium. Notice the boxes with the associated health scores for each resource associated with this location.
Finally, you can create your dashboard containing a map with your GEO Location tags in it. From the Home page, click on the plus sign to the right of the last dashboard tab.
This is the easiest part, just scroll down through the template sets on the left side of the screen to find the template containing the GEO widget - you can't miss it, it's the only one with a map! :)
Drag the template to the right side and drop it onto the placeholder there. You can change the name of the template if you wish. Save the template and you're done!
Of course, you can play around with the dashboard and use another widget if you don't want the heatmap. For example, I edited the dashboard to a single column so the map would take up the whole screen - much better if you have a lot of locations to view and are presenting this on a large screen at the NOC.
Reference the VMware vCenter Operations Manager Enterprise Administration Guide for vCenter Operations Manager Enterprise 5.0 for more details on configuring Resources.


No comments:
Post a Comment