Monday, July 29, 2013

Upgrading vCenter Configuration Manager from version 5.6 to 5.7

VMware released an update to vCenter Configuration Manager this month and I thought I would document my experience upgrading my lab instance.  The upgrade steps are clearly documented in the Advanced Install Guide starting on page 129 (as of this posting).  In my lab is a two-tier install as follows:

  VCMDB -
  • Windows 2008 R2 SP1 OS running MS SQL 2008 R2
  • Houses the vCM database services
  VCMCOLLECTORWEB

  • Windows 2008 R2 SP1 OS running MS SQL 2008 R2 and SSRS 2008 R2 
  • IIS 7
  • Houses the vCM collector and web services
One thing to note is that as of vCM 5.7 there is no requirement for vCM components to be installed on the DB server.  So, the first thing we will do for this two-tier upgrade is uninstall vCM from the DB server.

Loading the 5.7 installer on VCMDB, I will (1) click the radio button for the "Remove" operation (the documentation states "Uninstall" but there's no such option).  (2) Click "Next"...


Note the very stern warning on the next screen, promptly ignore it and (3) click "Uninstall" - do not worry, this doesn't remove the vCM database.


Uninstall proceeds... packages being removed... reticulating splines...


When the uninstall is finished, click "Finish" (do you really need a screen shot for this?).

You're done with the DB server, now I'll run the 5.7 installer on VCMCOLLECTORWEB.

This time, I will (1) select "Upgrade" and then (2) "Next"


You'll be able to "Next... Next... Next..." through most of this so I won't bother with things like the patent info screen or license acceptance.  You will note that the installer picks up all the components already installed as targets for upgrade, nothing to do here just FYI.


"Gathering System Information" can take a bit - took about 5 minutes on my lab instance.  But, all you need to see is "Checks were successful!" and then you can proceed.


On the next screen, the DB information should be pre-filled, I will go ahead and (3) click "Validate" to make certain everything is still in order - I get the message "Database validation successful." so I know I'm good-to-go!


You will continue to notice much of the information pre-filled, so just "Validate" as needed and click "Next" through the rest of the screens... I did get a nasty little note during the WebService validation which I believe was due to my using HTTP instead of HTTPS for this - I promptly dismissed it to no ill effect.


Likewise, I noted the User Rights message during the Collector Service Account setup page and dismissed it and continued on.


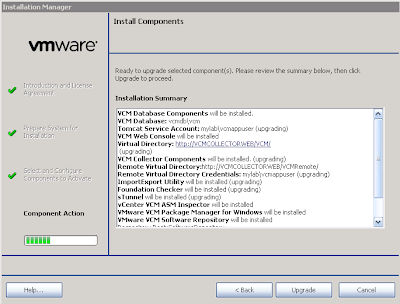
After about a dozen mouse clicks on the "Next" button you are then presented with the option to "Upgrade" which I happily clicked.


This part took about 25 minutes to complete in my lab.  Easy peasy!

Saturday, July 27, 2013

vCD vApp Deployment Fails for vCAC Blueprints on Windows Administrator password setting

I ran across this while building a lab for a customer this week and hopefully this will save you a little time.  When I built the vApps in vCloud Director 5.1.2 I selected the "Reset Password" option in the VM Properties as shown below....


However, this setting in a vApp template causes the vCAC vApp deployment workflow to fail with the following error:

Error in workflow cleanup. [Workflow Instance Id=somenumber] Error customizing vApp. Inner Exception: The administrator password cannot be empty when it is enabled and automatic password generation is not selected.

This is a 'feature' of the vCD 5.1.2 API and not a problem with vCAC.  It seems that passing the administrator password through the API was removed as of that release.  I understand that this is likely to be changed back in a future release - and I'll try to remember to update this post if/when that happens.

For now, you will need to disable the password reset within the VM properties for any template you wish to deploy from a vCAC vApp blueprint.

Wednesday, July 24, 2013

vCAC 5.2 Upgrade Gotcha - "Models table exists..."

The vCAC 5.2 upgrade process is pretty well document, but if you aren't paying attention (and I never pay attention) you could end up with an error show below:


"Error: Model Manager Data has been previously deployed.  Models table exists under the database DCAC"

You have probably completely uninstalled the previous vCAC instance.  Not what you want to do - you will uninstall practically everything else, DEMs, Agents, extensibility features, etc.  But, the upgrade still requires the existing core product to be in place.

Hope this saves some time for folks.  Hat tip to Eric H. for providing the screen shot.

Tuesday, July 23, 2013

Understanding and Validating vC Ops Sizing Recommendations

I got the same (well, similar) question today from two different customers so I thought a post explaining the vC Ops sizing recommendation views and reports was in order.  You may be familiar with the Oversized VM and Undersized VM reports available in vC Ops.  I typically caution that these are RECOMMENDATIONS and some additional research should be done before making a final call on resizing.

Let's look at an example from my lab.  I have a SQL database server which is showing up as undersized in vC Ops.


Note that the "% CPU Undersized" is slight (less than 3%) and there is no undersized concern for memory.

Now, a frequent misunderstanding is that the Workload score for a VM can be used to verify the sizing recommendation - this is not the case.  The capacity analysis is an average of the CPU and memory utilization over the time period specified in your configuration, by default daily average over 30 days (you can change this by going into "Configuration > Manage Display Settings > Edit > Non-Trend Views and adjusting "Interval to use:" and "Number of intervals to use:" settings).

On the other hand, the Workload badge reflects the current state of resource utilization.  For example my vCMDB server shows that memory is the most utilized resource when looking at Operations > Details > Workload Badge.  Memory is at 15% workload and also shows as the "BOUND BY" resource area. 

Note that vC Ops will display the BOUND BY for the highest scoring workload resource - it is a good indicator of a bottleneck if the workload is high, but in this case it is nothing to be concerned about.  Note also that the Dynamic Threshold for CPU (highlighted in yellow) is a pretty wide threshold.  This usually indicates a "peaky" behavior for that resource and thus a hint that while CPU is pretty docile at the current time, it's been known to spike.

So, it is important to understand this key difference - Health/Workload/Anomalies/Faults are all real-time indicators (well, nearly real-time - actually 5 minute granularity).  The capacity reports are AVERAGES over a given time period (by default 30 days).

Given that, how can I validate the sizing recommendations?

This is where the Operations > All Metrics feature comes into play.  From here, I can chart any metric collected from vCenter about any of the objects in a given time series.  For my purposes, I will chart the vCMDB server's CPU Demand and Memory Demand metrics over the past 30 days.


First, notice that there is a blue line indicating the metric five minute samples and a grey area behind the blue line.  The grey area is the Dynamic Threshold and I have displayed it for the entire 30 day period by selecting the option indicated by the red arrow in the image.  The blue arrow indicates the default of displaying only the 24 hour Dynamic Threshold.

Now as you look at this, you should notice that overall CPU (the top graph) demand regularly and predictably hits a CPU demand of 103% - that correlates very nicely with the information from the sizing recommendation.  Recall that we were undersized by about 2%-3% in that report.

Another thing to note is that memory usage is pretty consistent at somewhere between 1.5GB and 2GB (with a noteable exception around July 15th where a server reboot caused an anomaly).  Thus, the recommendation that memory is not undersized is spot on as well.

Finally, the Dynamic Threshold for memory makes a really nice granular shadow behind the blue line - our vC Ops analytics have pretty well nailed "normal" behavior for memory and that's a good thing.  On the other hand, CPU seems to have recalculated somewhere around July 18th - why would this happen?  Well, if you look closely at the graph, you may notice that the lower end of CPU utilization dropped after the server reboot on July 15th.  After about three days of this consistent "new" normal behavior, the analytic engine in vC Ops decided it was time to calculate this new normal and reset the Dynamic Threshold for this metric to a broader "high/low" while the detailed granularity is being figured out.

A couple of final thoughts:

  - Always validate the recommendations against the metric graphs, and I recommend using the "Demand" based metrics since they show what a VM would LIKE to use versus what it is actually USING.  Very important difference!
  - Consider your SLA, for example, even though I'm undersized during the peak workload that may not be impacting the ability to deliver the required service (think about a report that runs after hours, or a DB update - if I can still do it within the SLA window, why add resources?)